Emerging technology research & proposals
Role: Emerging technology research and pitches to our VP of UX.
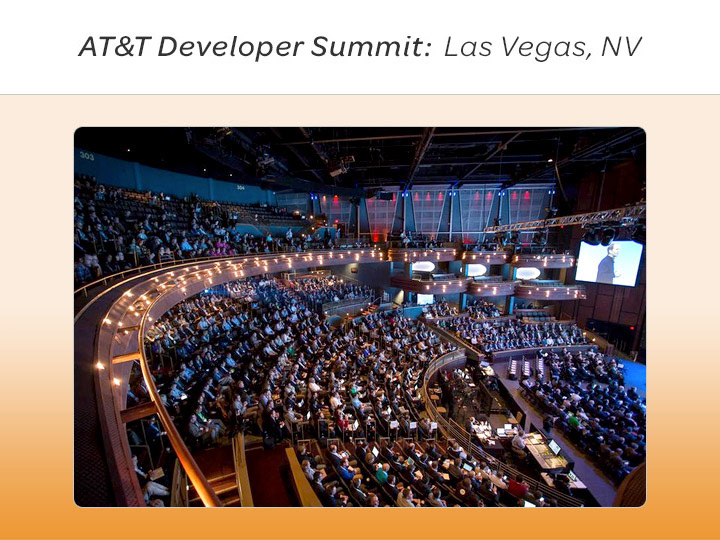
Approach: Not wanting to reinvent the wheel, I independently attended the AT&T Developer Summit in Las Vegas (now the AT&T Shape Conference) to learn about AT&T's roadmap and capacity on big data, AI and machine learning, voice assistants, blockchain encryption, quantum computing, AR and VR, etc. I was the only delegate in attendance from our UX organization.
Outcomes: I shared my findings and organizational contacts in two presentations to further connect and inform our UX and digital organizations with our R&D teams to anticipate how we might empower our processes.
The first report was an enormous compilation of use cases for A.I., machine learning, and various emerging tech.
The second presentation included specific findings from the AT&T Developer Summit.
Concept proposal descriptions below include 'AR Zones,' 'OrgView,' 'Body Keys, and 'Agile Clock'.
AR/VR team connect: UX ideation, organizational development & communication initiative
Role: I began as a proposal contributor; I also served as a team connector
Background: Our new Chief Digital Officer called for proposals around augmented reality, and I was invited to join an ideation group in Atlanta that was already developing an AR experience for the AT&T Lounge in Seattle.
Approach:
In addition to pitching AR wayfinding, it made sense to connect our ideation group with The AT&T Foundry to learn what they already have in development, to possibly gain support for our prototypes and share resources. Because our AR group was limited to their specific technologies, I sought to expand the scope and palette of innovation by connecting groups with different skill sets and resources.
Thanks to my attendance at the Developer Summit, I connected with the conference organizer who assisted in reaching a principal engineer at the AT&T Foundry and the assistant to Foundry leadership. I asked if our team could connect to learn what they were already working on and possibly collaborate.
Outcome: The principle engineer introduced Foundry team leads in five global locations, including two in Atlanta and some other local support resources. I introduced our group to the local teams, and they invited us to a sharing session to a prototyped demo on-site at a Foundry in downtown Atlanta. I also learned that the other Atlanta Foundry was exploring volumetric video for telepresence, a technology I had specifically proposed with my 'AR Zones' idea (below).
Three of my early pitches:
1. AR Zones: The idea proposes using real-time volumetric video, machine learning and interactivity for home, commercial, or industrial applications, including security, communications and entertainment. The idea is to stitch together 360-degree camera views in real-time for any environment and identify objects and anomalies in the scene to detect threats and patterns of interest. Users could then trigger responses manually using a tablet or AI systems could automate responses (targeting, lighting, alerts, etc.)
The idea comes from a Ukraine company, Limpid, who developed technology for situational awareness and visibility in military tanks around 2016-17. I thought to apply the same capabilities at AT&T, starting with their Digital Life services, and beyond. Digital Life was discontinued in 2022.
Update: August 7th, 2023:
Honeywell introduces the exact same concept and technology, Honeywell 360 (video).
More about Honeywell 360, here.
More about its application for safety in mining operations, here.
2. Body Keys: The idea proposes that AT&T retail stores offer 3D body scanning service to offer consumers a way of obtaining and continually updating a personalized digital fitting.
A good start might be to partner with major brands such as Levi’s and Nike – two retail items that pose challenges in fit and high returns with online purchasing.
Retailers would partner with AT&T to develop experiences that allow for fitting comparisons and simulations for purchases and production.
Body Keys can be useful for various services including physical and online clothing purchases, medical and health industry, insurance, industrial fittings, avatars, identification, etc., and can also work with product placement in interactive media.
Keys might also work with geolocation and AR wayfinding to guide consumers through physical retail centers or drive sales of customized clothing and equipment on demand.
I later found several companies who have either tried or are currently moving towards the use of 3D body scans, including Amazon and Nordstrom.
3. Agile Clock (post AT&T): Following my SAFe agile PO/PM course, I extended some of the ideas in the data-driven org chart to build an application for planning, tracking, and training agile teams in the form of a visual agile clock.
Well beyond a mere burn chart, the idea is to create an interactive map that allows teams to see and follow their place in a development cycle. The map could initially be built out from a set of weighted components for planning, with each component carrying values and measurements, including cost and velocities. It would allow everyone to learn and visualize Agile and the project scope and help understand, predict, and even simulate the impact of changes from stakeholders.
Although there are similar existing tools, I'm not aware of anything as comprehensive and visual. If so, please enlighten me!
Pitches: OrgView: AR wayfinding & data-driven org chart
Role: Independent initiative, proposal
Background & problems: In such an enormous organization, coordination of communication and awareness across teams is critical for efficient workflow.
Speaking with our tower's CEO in an 'Ask Me Anything' session, I inquired about the most painful blindspot for someone of her status and tenure. She said what keeps her up at night is not knowing when to dive in deeper to investigate project status rather than simply relying on what she is told.
Accompanying our CEO in the same session was VP of Corporate Solutions (HR), and when I asked what she uses for an org chart, she said 'We don't have one, I requested one yesterday'. She said org charts are too labor intensive and she relies on who she knows. Organizational awareness relies heavily on the corporate directory and internal wiki pages which are initiated by individual teams.
Approach: Following the discussions, I thought to apply the feedback toward a final project submission for an IDEO Observation for Innovation course I attended. I proposed a data-driven org chart app to shed light on team structure, function, project status, personnel, budget tracking and location.
The proposed app would offer data visualization and analytics combined with AR way-finding across campuses to better connect awareness of projects across teams via an intuitive walk-through. The proposal also explores new tools for virtual collaboration.
Outcomes: The project was well received by HR and development, particularly for navigating corporate real estate, and was earmarked for consideration...pending funding. One of the developers was particularly keen on applying QR codes across campuses for AR navigation.
Example layer data options include individual, org/business unit, project timelines:
• Talent/aptitude
• Individual history
• Role, org
• Personality – Myers Briggs, DISC or other taxonomy
(example use case: locate an extroverted developer)
• Areas of expertise/disciplines / skills
• FTE vs contract employees
• Location/contact info
• Organizational relationships
• Org history
• Lines of business, revenue
• Organization or project by discipline or area of interest
(example use case: search big data, personalization groups)
• Budgetary / funding information
• Search by project timeline
HR aspects:
• Communication, talent, and collaboration incubator
• Matching talent, personality, experience and skills to business goals
• Performance prediction
• Employee empowerment for organizational awareness
• Collaborate with other companies via secure open-data sharing
• Integration with LinkedIn, internal wikis for self-representation
• Private levels of deeper info.
Business intelligence aspects:
• Change management
(example use case: Are projects/efforts/budgets overlapping?)
• Acquisitions: transition of talent and resources
• Predictive aspects
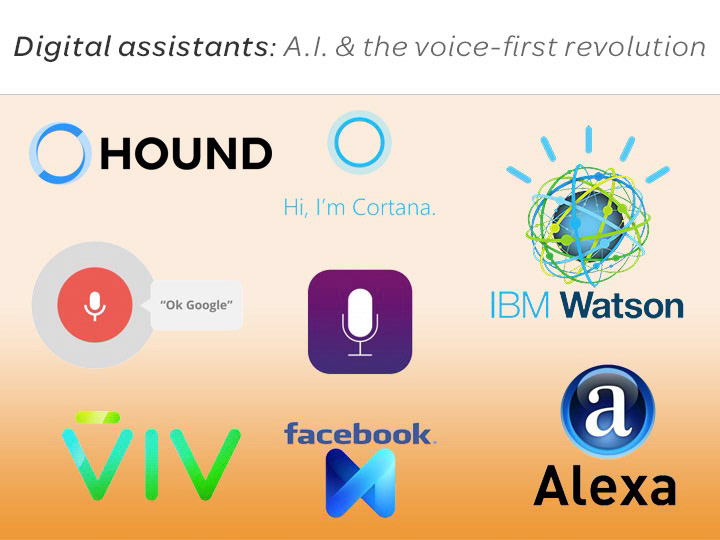
UX research: Digital assistants
Role: Contributor to a series on design principles.
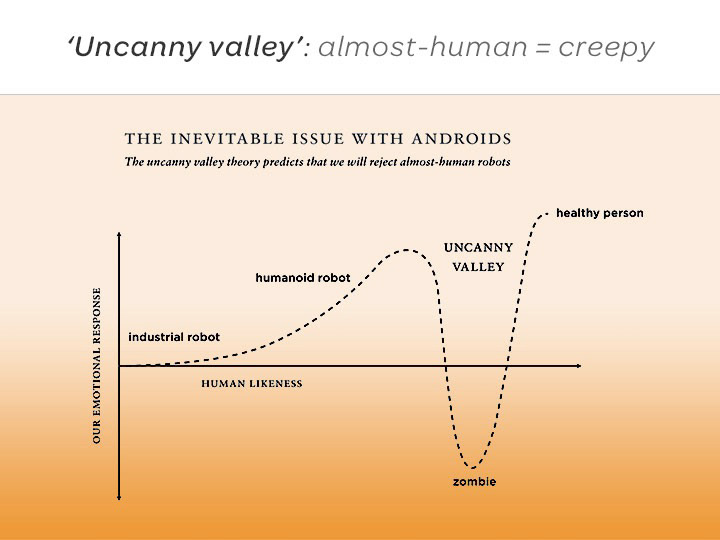
Approach: Having just finished reading "Enchanted Objects" by David Rose and "The Inevitable" by Kevin Kelly, I selected a topic related directly to emerging technology including AI and personalization - I investigated and presented the design principle/phenomenon of Baby-face bias.
Both books address the coming influence of machines with personality, and how they may become influential through facial features and voice via virtual assistants or androids.
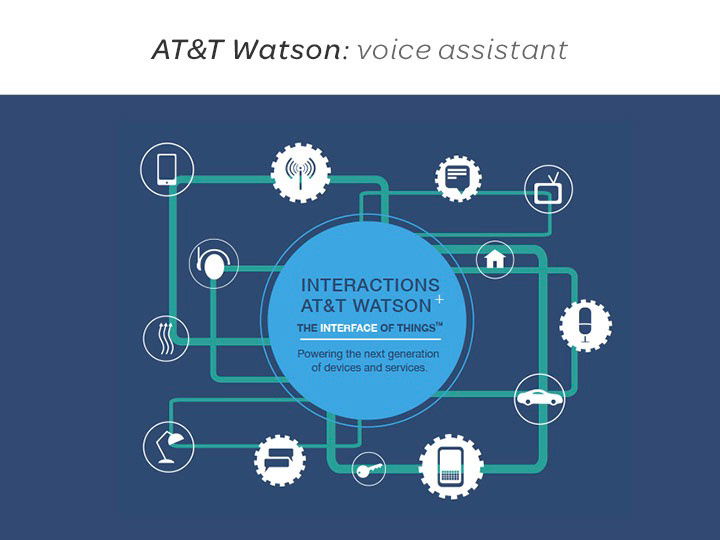
Outcomes: I investigated the various states of voice assistants, AR and VR, and I looked for relevant strategies and developments at AT&T.
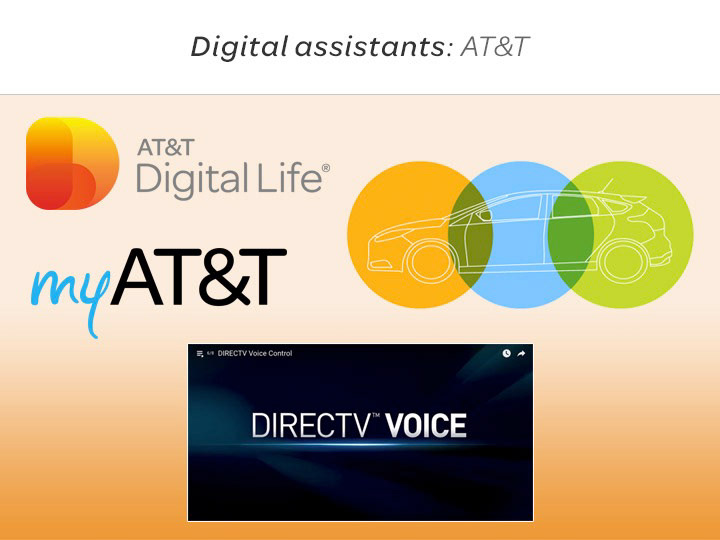
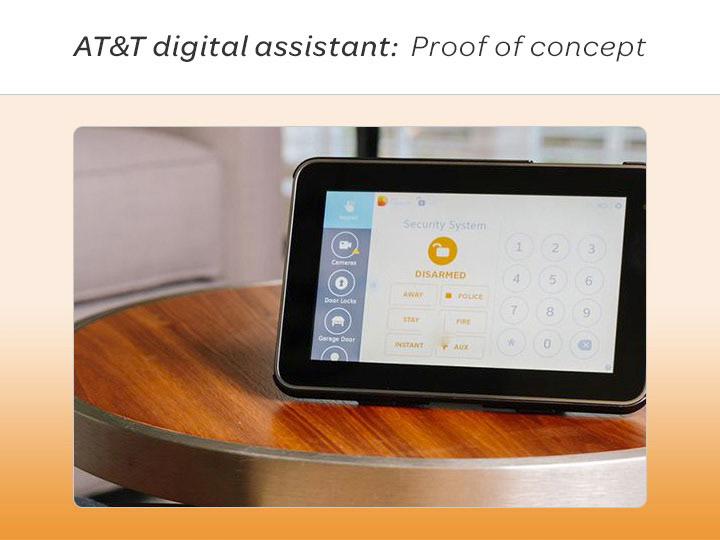
Coincidentally, there was a furious debate between our EVP of Design and the business team regarding developing a voice assistant and funding for personalization. Later, I attended our Developer Summit and met and interviewed an AT&T Foundry team member who introduced a digital assistant prototype.
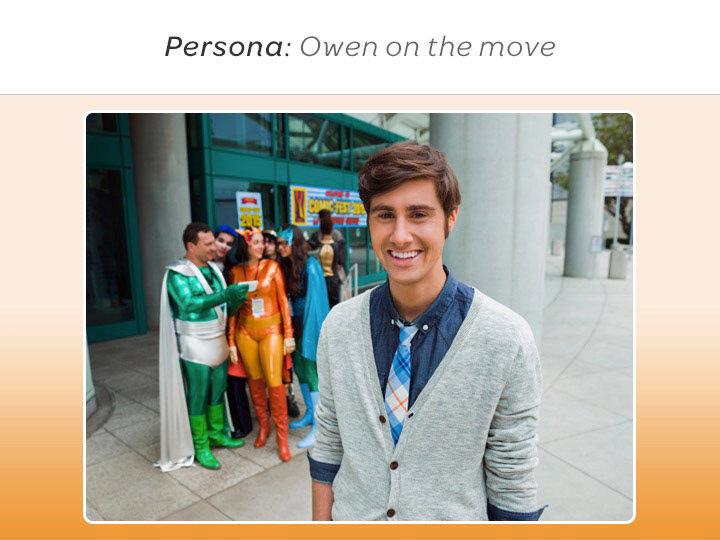
I also interviewed the marketing team responsible for AT&T's Owen on the Move campaign, recognizing that his youthful, digital native persona was deliberately chosen to lend confidence to customer support.
Sample slides below from the 50-slide deck