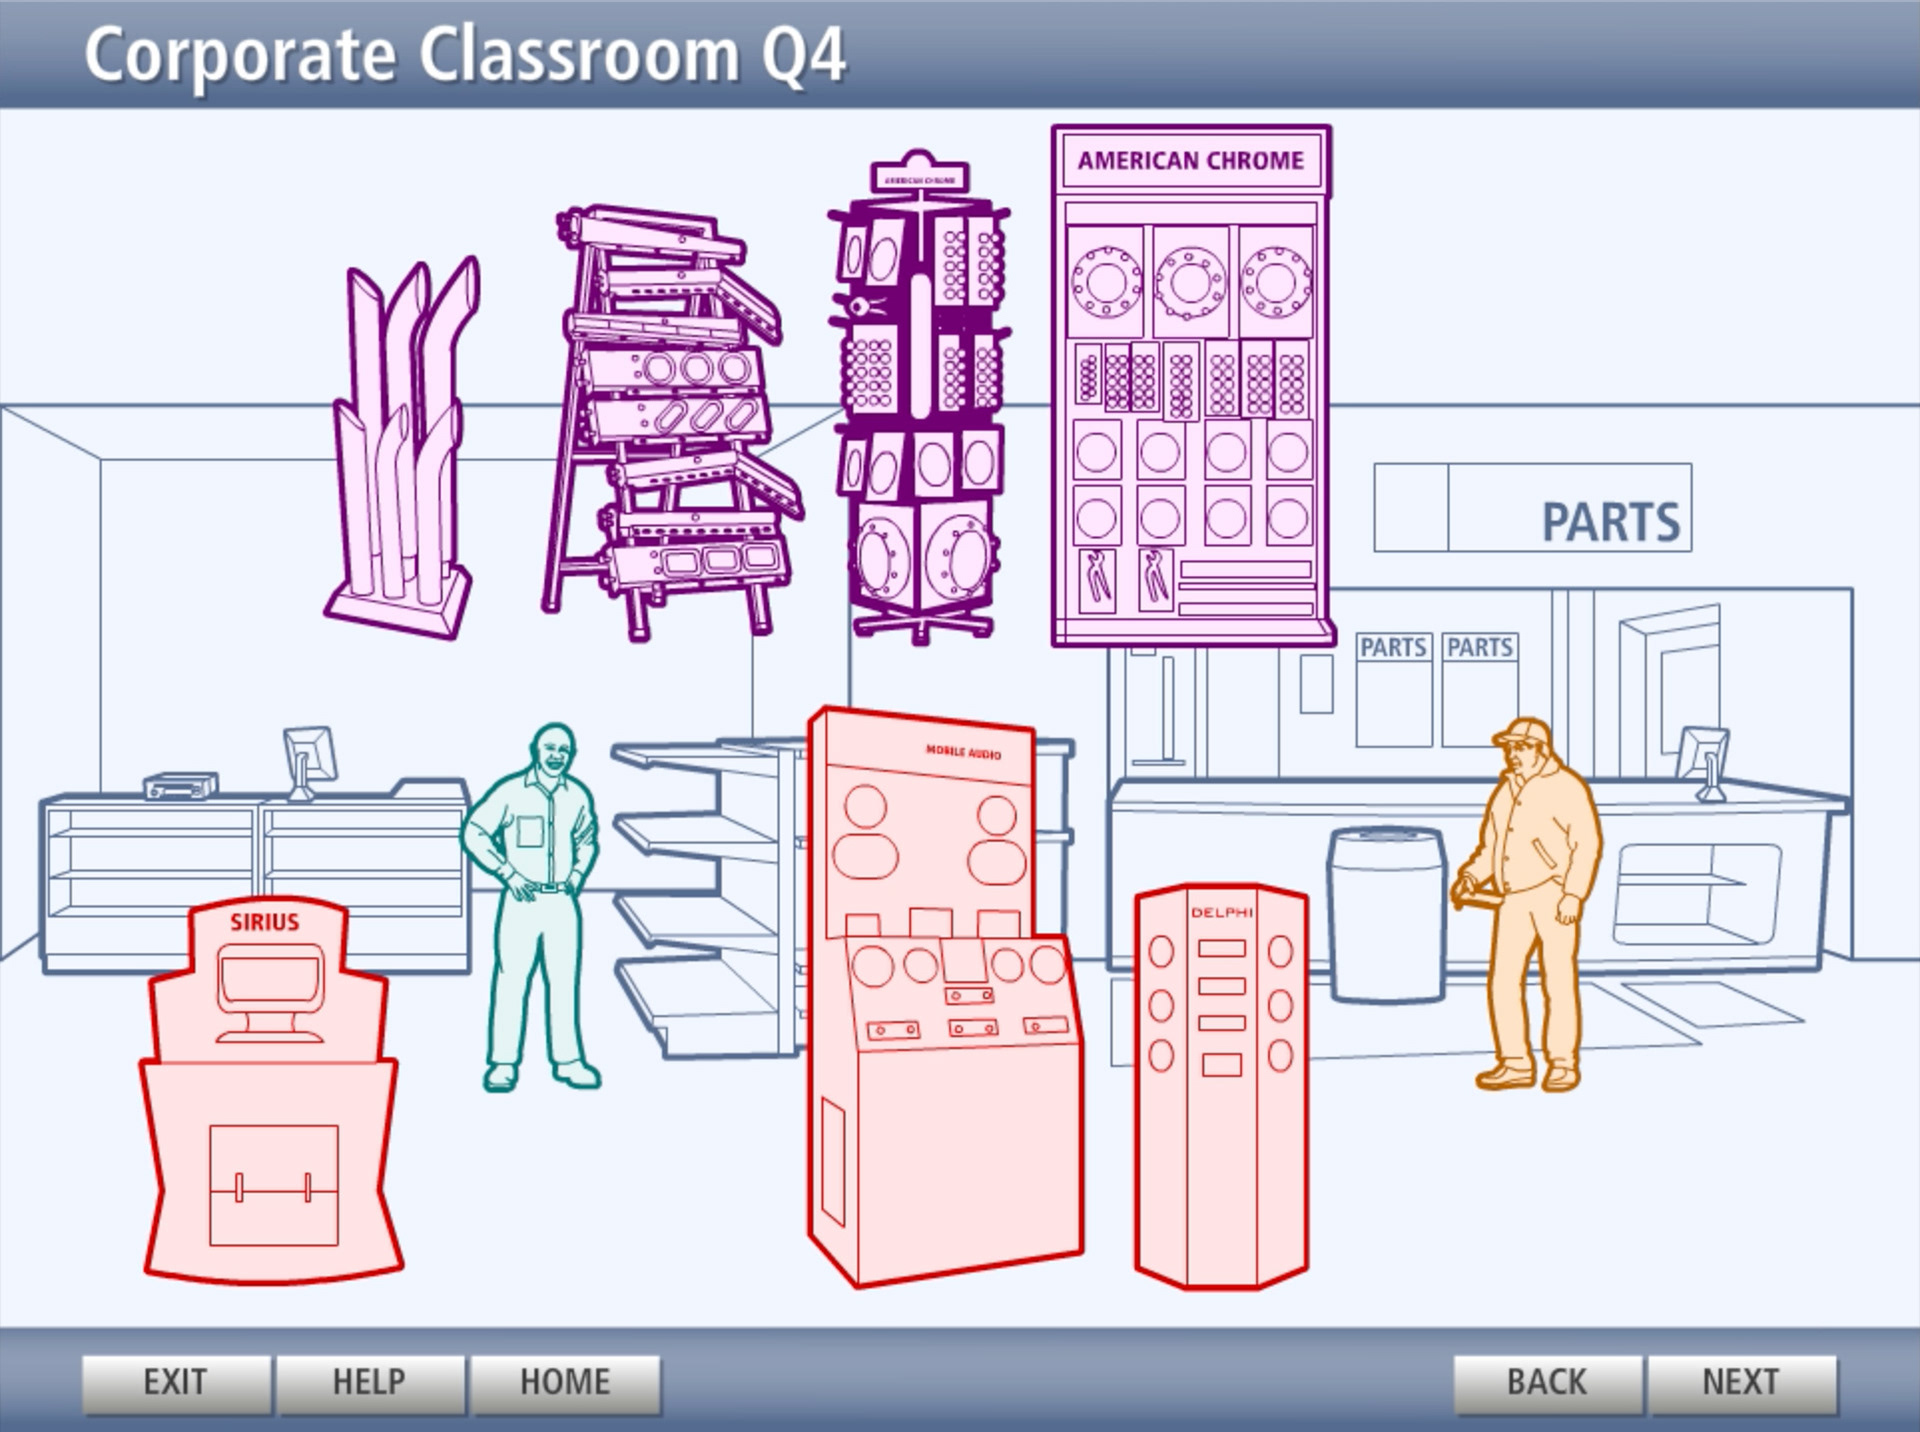
Volvo & Mack Truck: Interactive training module
Role: Interaction & graphic design
Background: After posting my profile on the E-Learning Guild website, I was invited to work on a project as an independent contractor.
Problem: The instructional designer needed to create a training module for properly setting up a showroom floor display, and she was open to interaction design ideas.
Solution: I proposed a drag-and-drop interaction. I requested photo references of the various floor elements to create color vector art and rollover states. I also updated the navigation interface.
Result: After completing the project, the manager offered a full-time position with Volvo and Mack Trucks in Greensboro, NC, but I accepted a competing offer from Sage Software in Atlanta, GA.
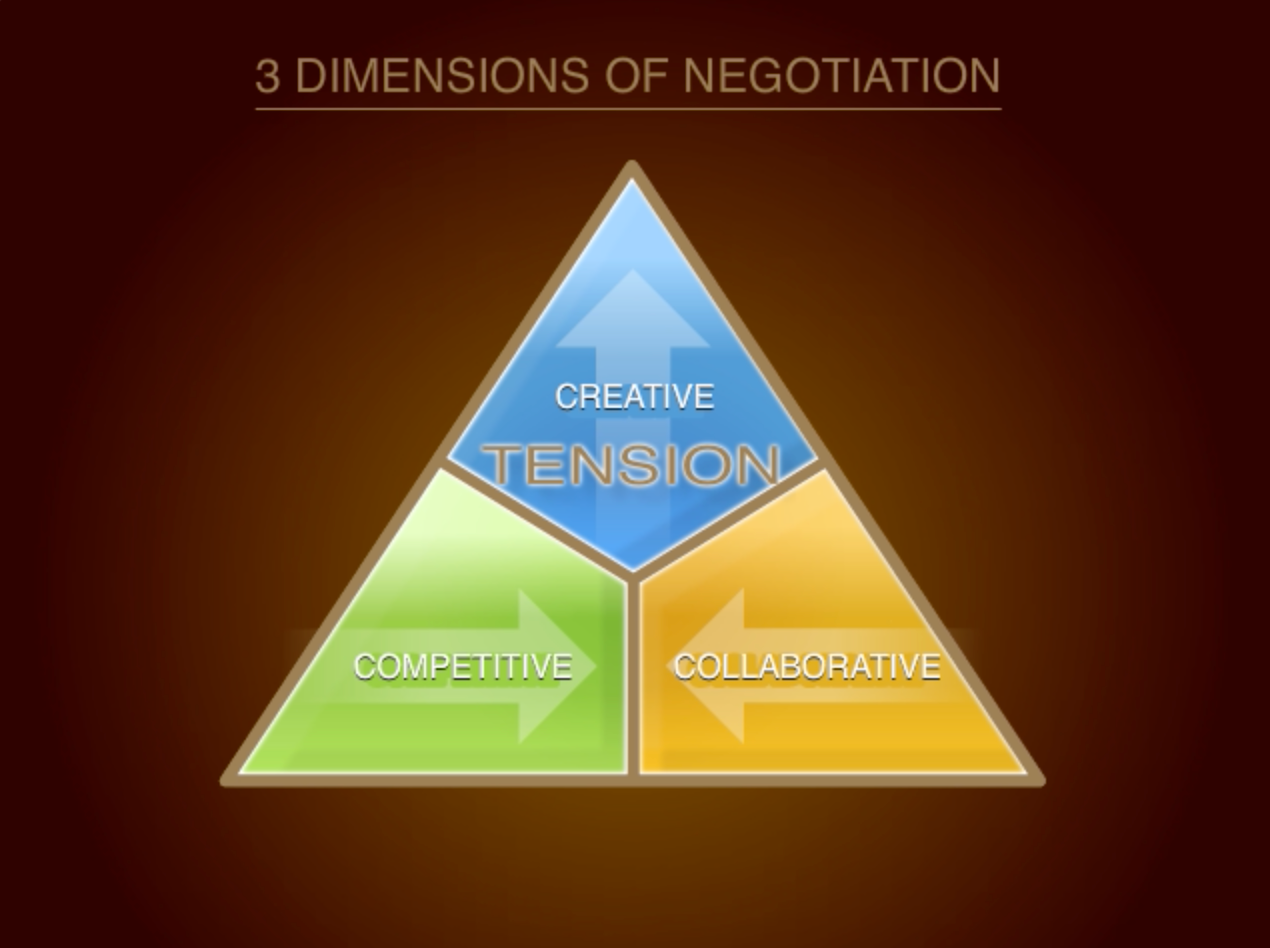
3 Dimensions of Negotiation motion graphic
Role: Graphic treatment and animation of an existing diagram.
Background: Created for interactive corporate sales negotiation training.
View the short animation.
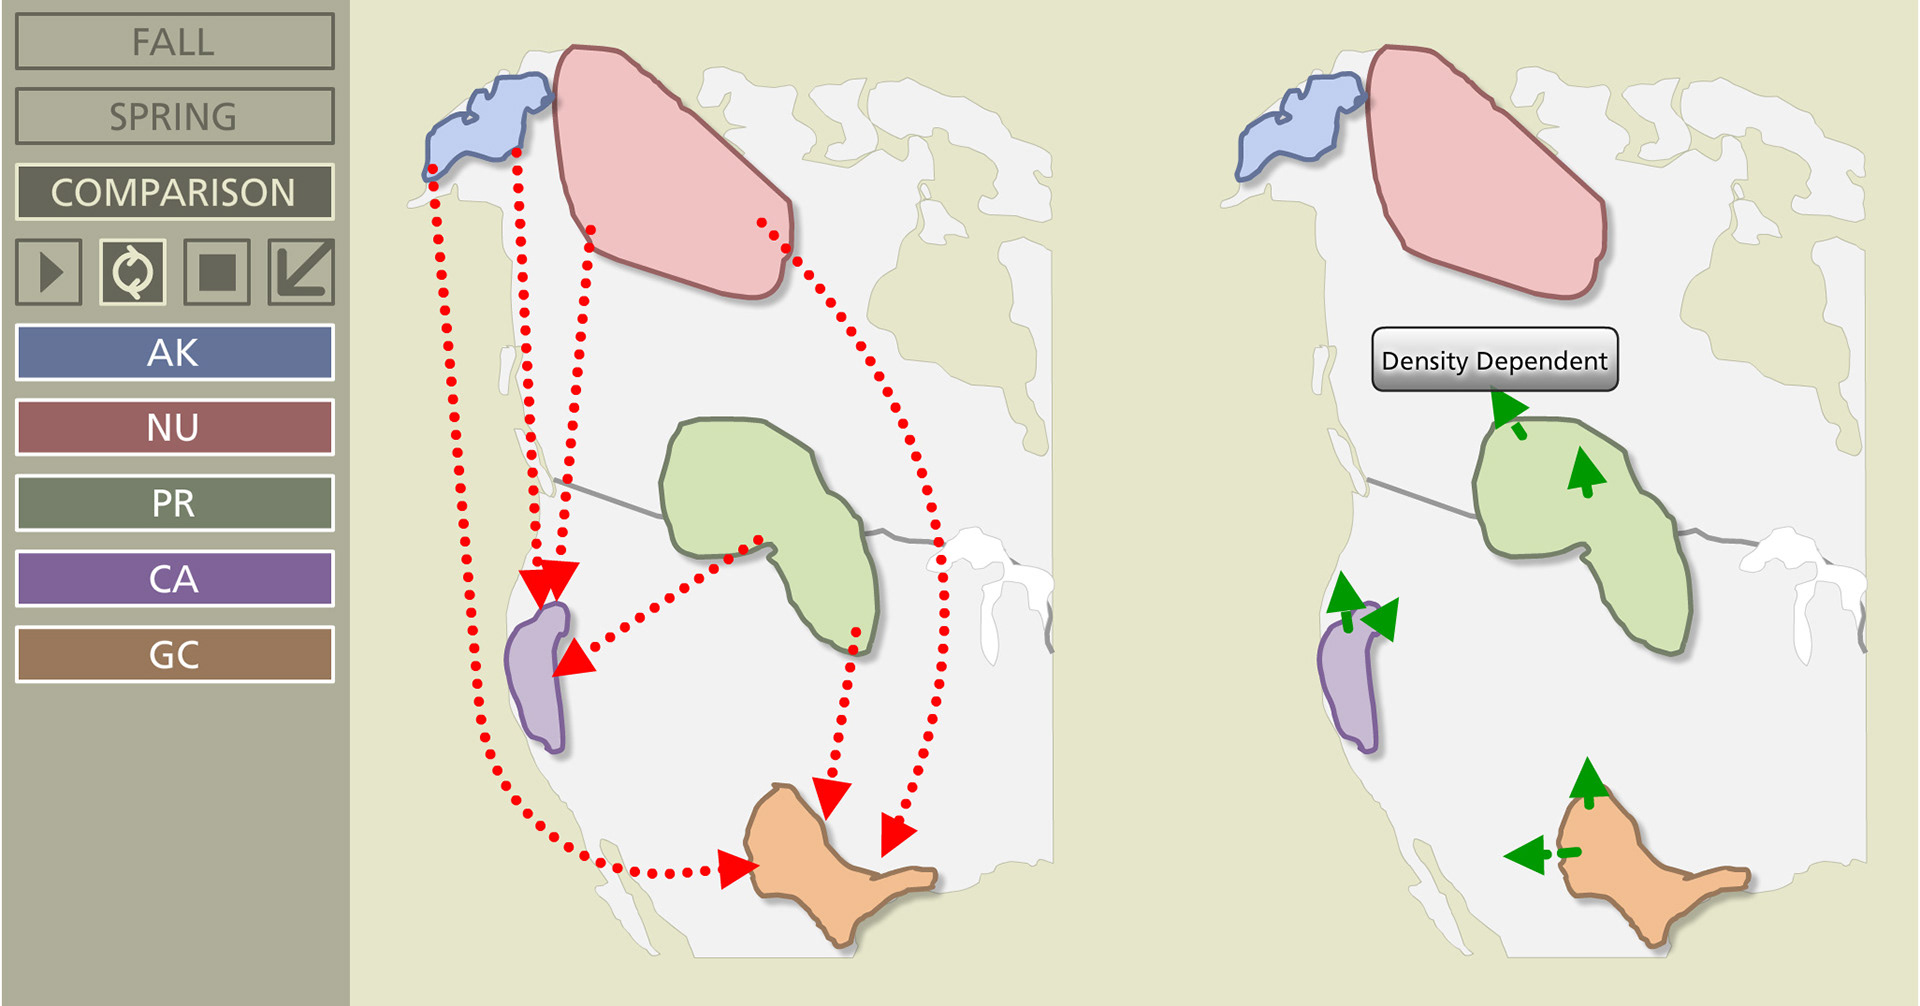
National Geological Survey: Interactive Migration Map
Role: Interaction & graphic design
Background: This interactive map represents the migration of the northern pintail during spring and fall between three breeding areas and two wintering areas, according to the research of Brady Mattsson, a friend and research ecologist for the U.S. Geological Survey.
Approach: We discussed Brady's objectives, including online communication and speaker presentations. I proposed an interactive presentation with motion. Brady drew the original map and migration paths, and I adjusted colors, animated the migration paths, and created an interface for interactively displaying various views.
The user selects one of the two seasons or a comparative map showing both seasons, and can then either play to show migration paths, loop the paths constantly, or stop, and can reveal regional labels globally with the 'label' icon or can mouse over each region to reveal abbreviated regional labels individually.
The user selects one of the two seasons or a comparative map showing both seasons, and can then either play to show migration paths, loop the paths constantly, or stop, and can reveal regional labels globally with the 'label' icon or can mouse over each region to reveal abbreviated regional labels individually.